
Diagnostics
The outcome is a reduced ability to form blood clots which can lead to excessive bleeding if left untreated. Indeed, low fibrinogen levels have been correlated to excessive blood loss during trauma, surgery and to the severity of postpartum haemorrhage, both of which present an increased risk of mortality (Frith et al., 2010; Rainer et al., 2011; Cortet et al., 2012; Gielen et al., 2014; Walden et al., 2014; Liu et al., 2018). Fibrinogen replenishment has been shown to improve outcome and therefore early assessment of fibrinogen levels and activity should be a key consideration for perioperative management (Mallaiah et al., 2015; Matsunaga et al., 2017; Li et al., 2018).
Fibrinogen replenishment may prevent excessive bleeding and save lives. Early assessment of fibrinogen deficiency using reliable and rapid diagnostic tests should therefore be at the forefront of perioperative management.
Figure 10. Quantitative and functional assays for measuring fibrinogen levels and activity. ELISA, enzyme-linked immunosorbent assay; FF, functional fibrinogen; FIBTEM, fibrin-based extrinsically activated test; PT, prothrombin time; ROTEM, rotational thromboelastometry; TEG, thromboelastography.
In this section, we discuss and compare the available diagnostic tools for measuring fibrinogen levels (quantitative assays) and quality (functional assays) (Figure 1). We also highlight recent data on the increasing use and reliability of point-of-care viscoelastic functional assays such as rotational thromboelastometry (ROTEM) and thromboelastography (TEG).
Traditional functional assays
The Clauss assay is the most commonly used assay for measuring fibrinogen function in the clinic (Clauss, 1957; Besser & McDonald, 2016). Other traditional functional assays from which fibrinogen function is derived include prothrombin time (PT), activated partial thromboplastin time (aPTT), thrombin time (TT) and reptilase time (RT).
Clauss Assay
The Clauss assay, also known as the von Clauss assay, is the most commonly used assay for measuring fibrinogen function in the clinic, with a turnaround time of 30 to 60 minutes (Huissoud et al., 2009; Solomon et al., 2011). Plasma is typically diluted to 1:10 and mixed with a high concentration of thrombin (usually 100 U/mL), phospholipid and calcium, all at body temperature (37°C). Plasma dilution reduces the effect of plasma factors that negatively impact on clotting efficiency during the reaction. The use of a high thrombin concentration ensures that thrombin does not become a limiting factor in the reaction.
Clot formation is measured by the time it takes for the reaction to achieve either:
- an optical density threshold, or
- a mechanical end point that measures the tensile strength of the clot
The latter is measured through loss of contact between a steel ball and a magnetic sensor, the result of their incorporation into the developing fibrin network (Schlimp et al., 2015). To correlate clotting time to fibrinogen levels, the clotting time is placed on to a calibration curve, created using a dilution range of plasma or standard with known fibrinogen concentrations, measured in g/L, plotted against clotting time. Importantly, fibrinogen concentration is inversely proportional to clotting time.
There are limitations to the Clauss assay. Optical density measurements may give false reads when fibrin monomer polymerisation is slow, however the assay is good for detecting weak fibrin formation. The presence of factors such as bile pigment and free haemoglobin can also impact on optical density readings (Mackie et al., 2003). Mechanical end points are sensitive at a low fibrinogen concentration; however, read-outs can be influenced by the presence of heparin, an anticoagulant drug that may have been administered to patients experiencing cardiac complications.
Prothrombin time (PT)-derived fibrinogen assay
The prothrombin time-derived fibrinogen assay, or PT-derived fibrinogen assay, is an indirect measure of fibrinogen concentration (Mackie et al., 2003; Undas et al., 2016). The prothrombin time, which has a normal range of 11 to 13.5 seconds (or international normalised ratio, INR, of 0.8–1.1), is used to estimate fibrinogen levels (Chernecky & Berger, 2013). Note that this normal range is dependent on the presence of vitamin K antagonists such as warfarin and phenprocoumon, which if present, produces an average INR range of 2–3. Like the Clauss assay, a calibration curve is generated using a standard plasma of known fibrinogen concentration measured by optical density. The key difference in this assay is the addition of thromboplastin to the reaction instead of thrombin. Thromboplastin converts prothrombin into thrombin which in turn impacts on fibrinogen conversion to fibrin. This assay is therefore an indirect measure of fibrinogen activity and a key limitation is that the results could be due to either low fibrinogen levels/function, or reduced levels of prothrombin.
Activated partial thromboplastin time (aPTT)-derived fibrinogen assay
Similar to the PT-derived fibrinogen assay, the aPTT-derived fibrinogen assay is an indirect measure of fibrinogen activity (Sobas et al., 2002). For the aPTT assay, platelet poor plasma that has undergone chelation to remove calcium is incubated at 37°C with phospholipid (cephalin), a contact activator (such as kaolin or micronised silica), and calcium in molar excess. Clotting time is measured from the addition of calcium and the aPTT is the time taken to form a fibrin clot with a normal range of 30–40 seconds, measured using optical density. The patient aPTT is used against a fibrinogen standard for estimating fibrinogen levels.
Other traditional methods
Other methods that can give an indication of fibrinogen activity include thrombin time (TT) and reptilase time (RT). Similar to the PT-derived fibrinogen assay, thrombin time is the time it takes for a plasma sample to create a clot when thrombin is added to the reaction, with a normal range of between 12 to 14 seconds (Hoffbrand, 2002; Lillicrap et al., 2009). Prolonged clotting time equates to either a quantitative or qualitative defect in fibrinogen (Hatton, 2008). This assay is particularly sensitive to the presence of heparin. If heparin is present, reptilase is instead added to the reaction in the place of thrombin, effectively giving a readout of reptilase time (RT), the normal range for which is 15 to 20 seconds (Lillicrap et al., 2009).
It is important to note that tests which focus solely on measuring fibrinogen function provide only a fraction of information on the overall haemostatic condition of a patient. To get an overall picture of coagulopathy in the clinic, particularly for cases of acquired fibrinogen deficiency, multiple tests may be needed in conjunction with fibrinogen testing. Decisions on which tests are needed should be influenced by the individual patient circumstance and their comorbidities.
Learn about point-of-care viscoelastic devices such as rotational thromboelastometry (ROTEM) and thromboeslastography (TEG) that can provide a better overview of coagulation, including fibrinogen function and fibrinolysis.
of interest
are looking at
saved
next event
Point-of-care functional assays
Viscoelastic devices such as rotational thromboelastometry (ROTEM) and thromboeslastography (TEG) measure overall coagulation ability by indicating clotting time, time to maximum clot strength and clot degradation (fibrinolysis) (Peng et al., 2018). They also provide a sensitive readout for the diagnosis of hyperfibrinolysis compared to other techniques such as immunochemical techniques that lack total biomarker specificity.
Since whole bloods can be tested quickly and in real-time with TEG and ROTEM devices, they are increasingly being used as point-of-care tools at the bedside for directing treatment choices made during surgical procedures (Peng et al., 2018). A study on perioperative samples taken from major paediatric surgery patients indicated no significant difference in readings for ROTEM testing carried out at the bedside versus in a laboratory setting, however bedside testing saved an average of 11 minutes compared to laboratory-based ROTEM testing (p<0.001) (Haas et al., 2012). Further, various studies covering cardiac surgery, trauma, postpartum haemorrhage (PPH) and liver transplantation have indicated that point-of-care coagulation testing leads to a reduced need for transfusions, reduced mortality and increased cost-effectiveness (Görlinger et al., 2011; Schöchl et al., 2011; Weber et al., 2012; Kirchner et al., 2014; Spahn et al., 2014; Leon-Justel et al., 2015; Mallaiah et al., 2015; Nardi et al., 2015; Roullet et al., 2015; Whiting et al., 2015; Solomon et al., 2016).
Despite recognition of the potential for the use of viscoelastic devices in the clinic, earlier limitations included ease of use as well as variability and accuracy concerns that were based on limited clinical data (Chitlur et al., 2011, Spahn et al., 2013). Full automation as well as more recent studies indicating improved reliability means that these devices, particularly ROTEM, are increasingly used to guide treatment decisions during medical procedures involving cardiac surgery, liver transplantation and PPH. To reflect this progress, the European Society of Anaesthesiology recommends viscoelastic assays for monitoring coagulation status in cases of peri-operative bleeding (Kozek-Langenecker et al., 2017). The 2019 European guidelines on management of major bleeding and coagulopathy following trauma recommends that resuscitation measures be continued using a goal-directed strategy, guided by the standard laboratory coagulation values and/or viscoelastic methods (Spahn et al., 2019).
Rotational thromboelastometry (ROTEM)
Rotational thromboelastometry (ROTEM) plots multiple aspects of the clotting cascade on to a trace in real-time. Initial indications of clot formation can be read as soon as 7 to 10 minutes following sampling, with full qualitative results available within 20 minutes (Collins et al., 2014). For the reaction, blood is mixed with reagents in a disposable container that has an oscillating sensor pin which detects changes in resistance as the reaction progresses. Greater resistance correlates with clot firmness. The changes in resistance are plotted on to a trace, the shape of which is used to determine readouts for both clot formation and degradation (Figure 2). ROTEM offers multiple channels for reactions that analyse different coagulation components (Crochemore et al., 2017):
- INTEM: activation of intrinsic pathway (contact phase) using ellagic acid (evaluates factors XII, XI, IX, VIII, X, V, II, I and von Willebrand)
- EXTEM: activation of extrinsic pathway using thromboplastin or tissue factor (evaluates factors II, VII, IX, X)
- HEPTEM: like INTEM but with neutralisation of heparin, using heparinase
- FIBTEM (fibrin-based extrinsically activated test): like EXTEM but with addition of cytochalasin D to inhibit platelet function, allowing for the analysis of fibrinogen on clot formation
- APTEM: activation like EXTEM but with addition of aprotinin to inhibit fibrinolysis. APTEM relative to EXTEM gives a true indication of hyperfibrinolysis
The resulting ROTEM trace provides the following values (Figure 2):
- CT (clotting time): time from mixing reagents to clot initiation detected as 2 mm amplitude
- CFT (clot formation time): time from CT to clot firmness of 20 mm amplitude
- alpha angle (α-angle): indication of how fast clot is forming
- A5/A10/A20: amplitude 5/10/20 minutes following CT
- MCF (maximum clot firmness): the maximum amplitude measured on trace
- LI30/LI60: clot lysis index 30/60 minutes following CT
- ML (maximum lysis): fibrinolysis is measured by ML > 15%
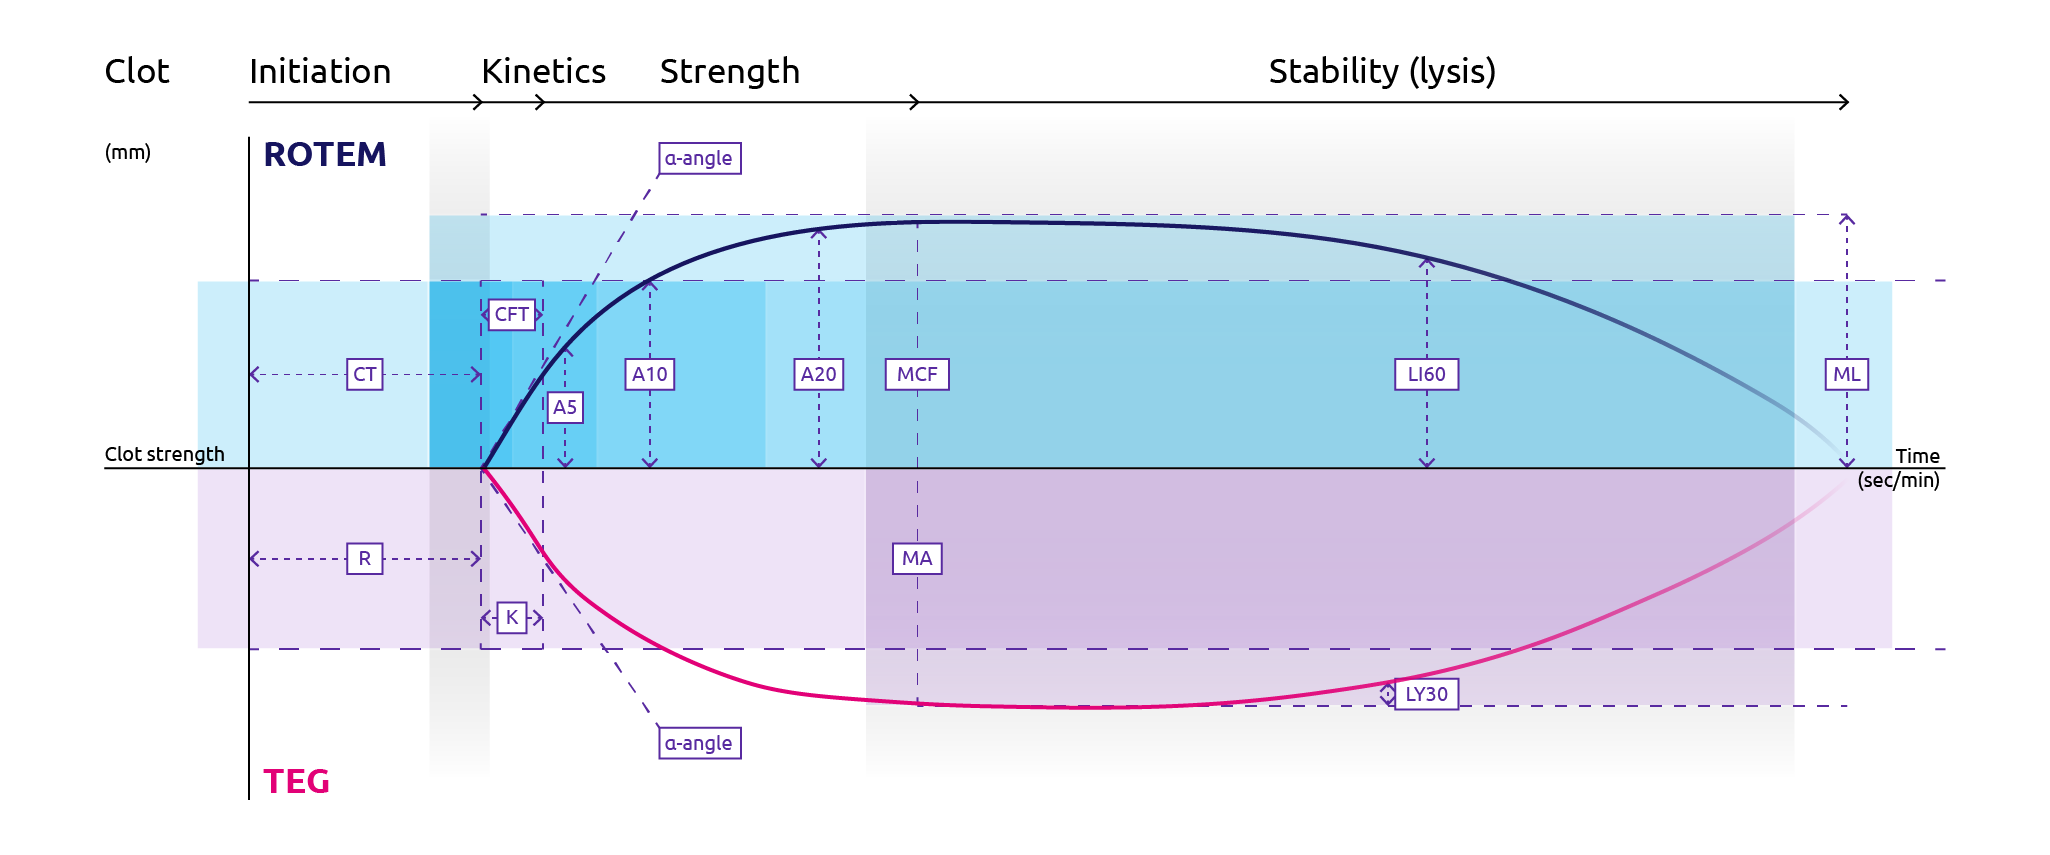
Figure 11. Features of plots for rotational thromboelastometry, ROTEM (top half) and thromboelastography, TEG (bottom half) (Adapted from Winearls et al., 2016).
For ROTEM: CT, clotting time; CFT, clot formation time; MCF, maximum clot firmness; LI60, lysis index 60 minutes following CT; ML, maximum lysis. For TEG: R, reaction time; K, clot formation time; MA, maximum amplitude; LY30, percentage lysis 30 minutes following maximum amplitude.
The FIBTEM and the EXTEM/APTEM ratio give an indication of fibrinogen deficiency and hyperfibrinolysis, respectively (Figure 3). The FIBTEM protocol assesses the impact of fibrinogen on clot formation with a readout of maximum clot firmness (MCF). In this reaction, a platelet inhibitor (cytocholasin D) is added to the reaction to remove the effect of platelet variation on the MCF readout (Bolliger et al., 2012). Correlation studies indicate that MCF readouts correlate positively with Clauss measurements for fibrinogen levels during cardiac surgery (Mace et al., 2016; Tirotta et al., 2019; ) liver transplantation (Roullet et al., 2010; Song et al., 2014; Hashir et al., 2019) and postpartum haemorrhage (Huissoud et al., 2009; Solomon et al., 2012; van Rheenan-Flach et al., 2013; Collins et al., 2014; Gillisen et al., 2019).
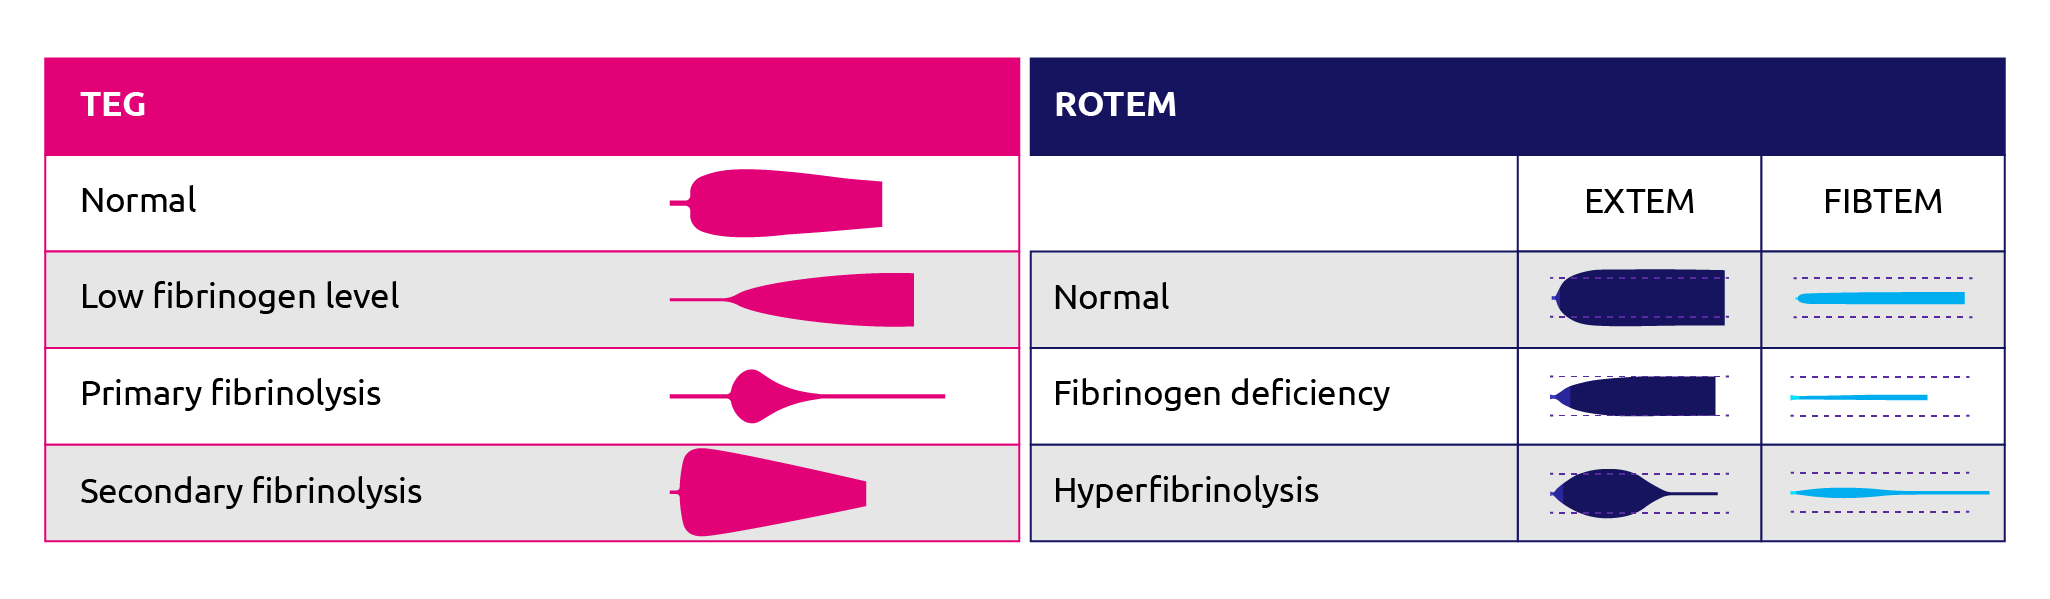
Figure 12. ROTEM and TEG traces for normal patient, patient with fibrinogen deficiency or fibrinolysis. (Adapted from Zostautiene et al., 2017; ROTEM, 2019).
The ROTEM EXTEM and APTEM protocols were found to be comparable to the standard euglobulin lysis time in accurately indicating ongoing hyperfibrinolysis in less than 15 minutes (Levrat et al., 2008). The APTEM reaction uses aprotinin to inhibit fibrinolysis whereas the EXTEM reaction does not. EXTEM viewed in the context of APTEM allows for accurate assessment of changes in EXTEM that can be attributed to hyperfibrinolysis. Roullet et al concluded that ROTEM EXTEM was useful for understanding overall coagulation during liver transplantation, and that the A10 value could guide platelet and fibrinogen transfusion (Roullet et al., 2010).
Despite the promise of these devices, some studies have highlighted both variability and accuracy issues in some contexts (Hunt et al., 2015; Seo et al. 2015; Blasi et al., 2017). For instance, Blasi et al indicate that FIBTEM MCF is not a good indicator of plasma fibrinogen after graft reperfusion during liver transplantation (Blasi et al., 2017). Whilst there have been recent improvements in the devices, such as full automation to remove user variability, more studies are required to understand the full potential for ROTEM in assessing fibrinogen and hyperfibrinolysis in specific clinical contexts.
Thromboelastography (TEG)
Similar to ROTEM, a thromboelastograph (TEG) depicts clot time, clot formation, clot stability and clot degradation, effectively plotting the interaction between fibrinogen, platelets and other clotting factors (Curry & Pierce, 2007; Hunt et al., 2015) (Figure 2). The functional fibrinogen (FF) assay of TEG measures the stability of polymerised fibrin. Platelets also contribute to clot strength and is a factor that varies depending on the individual patient situations. For this reason, the FF reaction is treated with the glycoprotein IIb/IIIa platelet inhibitor abciximab to eliminate the effect of platelet variation on the FF readout.
ROTEM is based on TEG, however unlike ROTEM which uses an optical detector, a torsion wire is used to measure clot formation in TEG. TEG also initiates movement through rotation of the cuvette, rather than the pin. The interpretation for ROTEM and TEG results is similar but they are not interchangeable, and there is evidence that they can yield differing results, particularly for fibrin clotting ability (Solomon et al., 2012; Rizoli et al., 2016) (Table 1). The outcome for TEG is a trace that is directly related to clot strength and allows for the assessment of different coagulation states; however, the nomenclature is somewhat different to that of ROTEM.
- R value (reaction time): The time taken from start until TEG amplitude reaches 2 mm, which corresponds to fibrin formation. Note that this time is prolonged in severe hypofibrinogenaemia.
- K value (clot formation time): The time taken from R-time until TEG amplitude reaches 20 mm, which corresponds to clot firmness. Note that this time is prolonged in cases of hypofibrinogenaemia.
- α-angle: Angle formed between the middle of the trace and a line drawn between the R and K-values. This is a function of the rate of fibrin polymerisation and is decreased in hypofibrinogenaemia.
- MA (maximum amplitude): Highest amplitude achieved which is representative of maximum clot strength. This is decreased in the case of hyperfibrinolysis.
- LY30/A30: a measurement of the percentage lysis 30 minutes following the maximum amplitude.
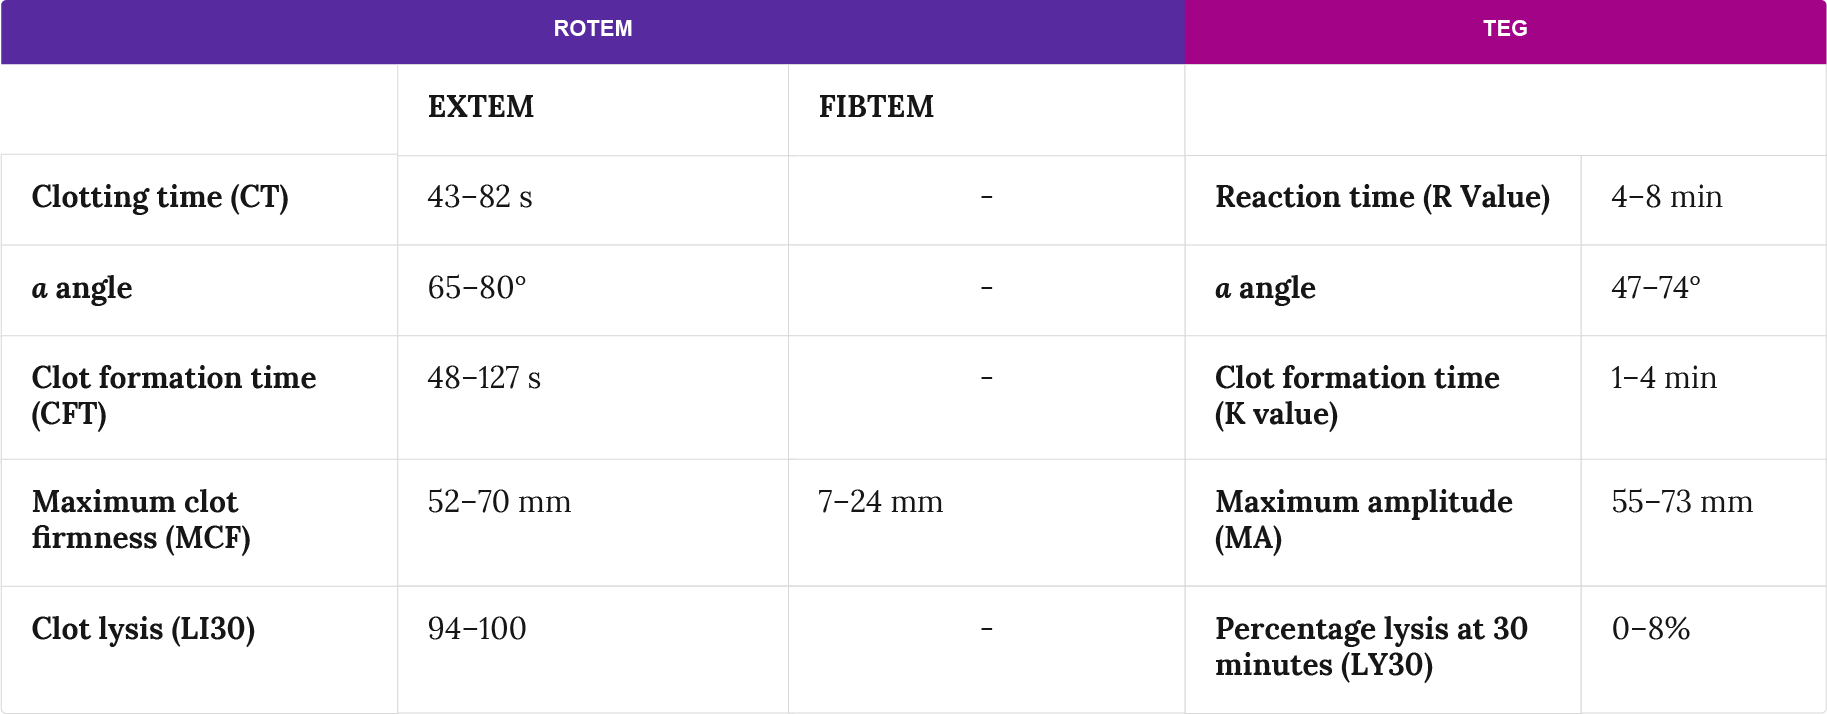
Table 1: Reference values for rotational thromboelastometry, ROTEM and thromboelastography, TEG (adapted from Walsh et al., 2011; ROTEM, 2019).
TEG MA readings for fibrinogen have been positively correlated to fibrinogen levels measured using the standard Clauss assay in a trauma (Harr et al., 2013; Kornblith et al., 2014; Meyer et al., 2014; Meyer et al., 2015; Peng et al., 2018) and liver transplantation setting (Yang et al., 2014). For cardiac surgery patients, the correlation is less clear. Some studies indicate a moderate correlation between TEG MA and Clauss fibrinogen levels (Fluger et al., 2011; Fluger et al., 2012; Gautam et al., 2017) whereas at least one study indicated that there is no correlation (Agarwal et al., 2015).
Whilst functional fibrinogen assays provide an indication of how much active fibrinogen is present in a patient sample, quantitative fibrinogen assays provide a better indication of the levels of fibrinogen present.
Other point-of-care devices
The latest point-of-care devices are being designed with the emergency setting in mind. One such device is the HemoSonics Quantra® which uses novel patented ultrasound technology (sonic estimation of elasticity via resonance, SEER) to measure clot stiffness. This new technology means that readings supposedly remain accurate even in the presence of vibration. The device is small, performs automatic quality checks every 8 hours, and uses a blood collection cartridge that negates the need for sample handling. New devices such as the HemoSonics Quantra® also aim to minimise decision-making and simplify display, both time-saving measures.
Learn about traditional functional assays such as the Clauss assay and the PT-derived assay in the traditional functional assays tab of this section. For more on quantitative fibrinogen assays, such as ELISA and clottable protein assay that are used to confirm congenital fibrinogen deficiencies, see the quantitive fibrinogen assays in the next tab in this section.
of interest
are looking at
saved
next event
Quantitative fibrinogen assays
Quantitative measurement of fibrinogen can be carried out using various immunological assays and the clottable protein assay (Mackie et al., 2003). It is important to note that whilst these assays give an indication of how much fibrinogen is present, they do not give an indication of the functional activity of fibrinogen. They are therefore used alongside functional assays to determine fibrinogen levels and activity, and are most often used to confirm suspected cases of congenital fibrinogen deficiency alongside genetic analysis.
Immunological assays
Immunological assays allow for quantitative measurements since they detect antigen, however it is not possible to distinguish between functional and non-functional protein. They are also time consuming and can take many hours to complete. They are therefore not regularly used to diagnose fibrinogen deficiency in acute settings; however, they are often used to confirm congenital fibrinogen deficiency. The enzyme-linked immunosorbent assay (ELISA) is the most accurate and widely used immunological assay compared to other techniques such as electrophoretic techniques, radial immunodiffusion, rapid latex agglutination, immune turbidimetry and nephelometry (Mackie et al., 2003; Chen et al., 2010). Polyclonal antibodies are generally utilised for these assays to ensure full coverage of fibrinogen protein; however, monoclonal antibodies that are specific to non-proteolysed fibrinogen are also available. The latter allows for the identification of fibrinogen that has not been processed through plasmin digestion and gives a better indication of functional fibrinogen levels.
Clottable protein assay
A clottable protein assay can be used to determine clot weight. In this assay, thrombin is added to patient sample plasma in the absence of calcium ions. The resulting clot is washed and treated with alkaline urea for protein measurement by spectrophotometry (Ratnoff & Menzie, 1951; Jacobsson et al., 1955, Blomback & Blomback, 1956). Since fibrin is the only protein in the clot structure, the protein concentration achieved is related directly to the amount of fibrin present in clots. This diagnostic test is therefore highly accurate and is often used to confirm congenital fibrinogen deficiencies; however, it is not used as a standard diagnostic test since it is a time-consuming and laborious technique (Mackie et al., 2003).
of interest
are looking at
saved
next event
Diagnostics references
Agarwal S, Johnson RI, Shaw M. A comparison of fibrinogen measurement using TEG(®) functional fibrinogen and Clauss in cardiac surgery patients. Int J Lab Hematol. 2015;37:459–65.
Besser MW, MacDonald SG. Acquired hypofibrinogenemia: current perspectives. J Blood Med. 2016;7:217–25.
Blasi A, Sabate A, Beltran J, Costa M, Reyes R, Torres F. Correlation between plasma fibrinogen and FIBTEM thromboelastometry during liver transplantation: a comprehensive assessment. Vox Sang. 2017;112:788–95.
Blomback B, Blomback M. Preparation of human fibrinogen fraction 1–2. Arkiv for Kemi. 1956;10:415–43.
Bolliger D, Seeberger MD, Tanaka KA. Principles and practice of thromboelastography in clinical coagulation management and transfusion practice. Transfus Med Rev. 2012;26:1–13.
Chen Q, Hua X, Fu W, Liu D, Chen M, Cai G. Quantitative determination of fibrinogen of patients with coronary heart diseases through piezoelectric agglutination sensor. Sensors (Basel). 2010;10:2107–18.
Chernecky CC, Berger BJ. Laboratory Tests and Diagnostic Procedures. 6th ed. St Louis, MO: Elsevier Saunders;2013:930–5.
Chitlur M, Sorensen B, Rivard GE, Young G, Ingerslev J, Othman M et al. Standardization of thromboelastography: a report from the TEG‐ROTEM working group. Haemophilia. 2011;17:532–37.
Clauss A. Rapid physiological coagulation method in determination of fibrinogen. Acta Haematol. 1957;17:237–246.
Collins PW, Lilley G, Bruynseels D, Laurent DB, Cannings-John R, Precious E et al. Fibrin-based clot formation as an early and rapid biomarker for progression of postpartum hemorrhage: a prospective study. Blood. 2014;124:1727–36.
Cortet M, Deneux-Tharaux C, Dupont C, Colin C, Rudigoz RC, Bouvier-Colle MH, et al. Association between fibrinogen level and severity of postpartum haemorrhage: secondary analysis of a prospective trial. Br J of Anaesth. 2012;108:984–9.
Crochemore T, de Toledo Piza FM, dos Reis Rodrigues R, de Campos Guerra JC, Ferraz LJR, Correa TD. A new era of thromboelastometry. Enstein (Sao Paulo). 2017;15:380–85.
Curry ANG, Pierce JMT. Conventional and near-patient tests of coagulation. Continuing Education in Anaesthesia Critical Care & Pain. 2007;7:45–50.
Fluger I, Maderova K, Simek M, Hajek R, Zapletalova J, Lonsky L. Comparison of functional fibrinogen assessment using thromboelastography with the standard von Clauss method. Biomedical Papers. 2012;156:260–61.
Fluger I, Maderova K, Simek M, Hajek R, Zapletalova J, Lonsky V. The effect of a cardiopulmonary bypass system with biocompatible coating on fibrinogen levels determined by the TEG--functional fibrinogen method: preliminary results. Perfusion. 2011;26:503–9.
Frith D, Goslings JC, Gaarder C, Maegele M, Cohen MJ, Allard S et al. Definition and drivers of acute traumatic coagulopathy: clinical and experimental investigations. Journal of thrombosis and haemostasis. 2010;8:1919–25.
Gautam NK, Cai C, Pawelek O, Rafique MB, Cattano D, Pivalizza. Performance of functional fibrinogen thromboelastography in children undergoing congenital heart surgery. Paediatr Anaesth. 2017;27:181–189.
Gielen C, Dekkers O, Stijnen T, Schoones J, Brand A, Klautz R et al. The effects of pre- and postoperative fibrinogen levels on blood loss after cardiac surgery: a systematic review and meta-analysis. Interact Cardiovasc Throac Surg. 2014;18:292–8.
Gillissen A, van den Akker T, Caram-Deelder C, Henriquez DDCA, Bloemenkamp KWM, Eikenboom J et al. Comparison of thromboelastometry by ROTEM® Delta and ROTEM® Sigma in women with postpartum haemorrhage. Scandinavian Journal of Clinical and Laboratory Investigation. 2019;DOI: 10.1080/00365513.2019.1571220.
Görlinger K, Dirkmann D, Hanke AA, Kamler M, Kottenberg E, Thielmann M et al. First-line therapy with coagulation factor concentrates combined with point-of-care coagulation testing is associated with decreased allogeneic blood transfusion in cardiovascular surgery: a retrospective, single-center cohort study. Anesthesiology. 2011;115:1179–91.
Gorlinger K, Bhardwaj V, Kapoor PM. Simulation in coagulation testing using rotational thromboelastometry: A fast emerging, reliable point of care technique. Ann Card Anaesth. 2016;19:516–20.
Haas T, Spielmann N, Mauch J, Speer O, Schmugge M, Weiss M. Reproducibility of thrombelastometry (ROTEM®): Point-of-care versus hospital laboratory performance. Scandinavian Journal of Clinical and Laboratory Investigation. 2012;72:313–17.
Harr JN, Moore EE, Ghasabyan A, Chin TL, Sauaia A, Banerjee A et al. Functional fibrinogen assay indicates that fibrinogen is critical in correcting abnormal clot strength following trauma. Shock. 2013;39:45–49.
Hashir A, Singh SA, Krishnan G, Subramanian R, Gupta S. Correlation of early ROTEM parameters with conventional coagulation tests in patients with chronic liver disease undergoing liver transplant. Indian Journal of Anaesthesia. 2019;63:21–25.
Hatton, Chris. Haematology (Lecture Notes). Cambridge, MA: Blackwell Publishers; 2008.
Hoffbrand AV. Essential haematology. Oxford: Blackwell Science; 2002.
Huissoud C, Carrabin N, Audibert F, Levrat A, Massignon D, Berland M et al. Bedside assessment of fibrinogen level in postpartum haemorrhage by thrombelastometry. BJOG. 2009;116:1097–102.
Hunt H, Stanworth S, Curry N, Woolley T, Cooper C, Ukoumunne O et al. Thromboelastography (TEG) and rotational thromboelastometry (ROTEM) for trauma induced coagulopathy in adult trauma patients with bleeding. Cochrane Database of Systematic Reviews. 2015;2. Art. No.: CD010438. DOI: 10.1002/14651858.CD010438.pub2.
Jacobsson, K. Studies in the determination of fibrinogen in human blood plasma. Scandinavian Journal of Clinical Laboratory Investigation. 1955;7:1–54.
Kirchner C, Dirkmann D, Treckmann JW, Paul A, Hartmann M, Saner FH et al. Coagulation management with factor concentrates in liver transplantation: a single-center experience. Transfusion. 2014;54:2760–8.
Kornblith LZ, Kutcher ME, Redick BJ, Calfee CS, Vilardi RF, Cohen MJ. Fibrinogen and platelet contributions to clot formation: Implications for trauma resuscitation and thromboprophylaxis. Journal of Trauma and Acute Care Surgery. 2014;76:255–63.
Kozek-Langenecker SA, Ahmed AB, Afshari A, Albaladejo P, Aldecoa C, Barauskas G et al. Management of severe perioperative bleeding: guidelines from the European Society of Anaesthesiology: First update 2016. Eur J Anaesthesiol. 2017;34:332–395.
Leon-Justel A, Noval-Padillo JA, Alvarez-Rios AI, Mellado P, Gomez-Bravo MA, Alamo JM et al. Point-of-care haemostasis monitoring during liver transplantation reduces transfusion requirements and improves patient outcome. Clin Chim Acta. 2015;446:277–83.
Levrat A, Gros A, Rugeri L, Inaba K, Floccard B, Negrier C et al. Evaluation of rotation thrombelastography for the diagnosis of hyperfibrinolysis in trauma patients. Br J Anaesth. 2008;100:792–7.
Li J, Gong J, Zhu F, Moodie J, Newitt A, Uruthiramoorthy L et al. Fibrinogen concentrate in cardiovascular surgery: A meta-analysis of randomized controlled trials. Anesthesia & Analgesia. 2018;127:612–21.
Lillicrap D, Key N, Makris M, O'Shaughnessy D. Practical Hemostasis and Thrombosis. Wiley-Blackwell; 2009.
Liu J, Sun L, Wang J, Ji G. The relationship between fibrinogen and in-hospital mortality in patients with type A acute aortic dissection. Am J Emerg Med. 2018;36:741–4.
Mace H, Lightfoot N, McCluskey S. Validity of thromboelastometry for rapid assessment of fibrinogen levels in heparinized samples during cardiac surgery: a retrospective, single-center, observational study. J Cardiothorac Vasc Anesth. 2016;30:90–95.
Mackie IJ, Kitchen S, Machin SJ, Lowe GD. Guidelines on fibrinogen assays. British Journal of Haematology. 2003;121:396-404.
Mallaiah S, Barclay P, Harrod I, Chevannes C, Bhalla A. Introduction of an algorithm for ROTEM-guided fibrinogen concentrate administration in major obstetric haemorrhage. Anaesthesia. 2015;70:166–75.
Matsunaga S, Takai Y, Nakamura E, Era S, Ono Y, Yamamoto K et al. The clinical efficacy of fibrinogen concentrate in massive obstetric haemorrhage with hypofibrinogenaemia. Sci Rep. 2017;7:46749. doi: 10.1038/srep46749.
Meyer ASP, Meyer MAS, Sørensen AM, Rasmussen LS, Hansen MB, Holcomb JB et al. Thrombelastography and rotational thromboelastometry early amplitudes in 182 trauma patients with clinical suspicion of severe injury. Journal of Trauma and Acute Care Surgery. 2014;76:682–90.
Meyer MAS, Ostrowski SR, Sørensen AM, Meyer AS, Holcomb JB, Wade CE et al. Fibrinogen in trauma, an evaluation of thrombelastography and rotational thromboelastometry fibrinogen assays. Journal of Surgical Research. 2015;194:581–90.
Nardi G, Agostini V, Rondinelli B, Russo E, Bastianini B, Bini G et al. Trauma-induced coagulopathy: impact of the early coagulation support protocol on blood product consumption, mortality and costs. Crit Care. 2015;19:83.
NICE guidance. Detecting, managing and monitoring haemostasis: viscoelastometric point-of-care testing (ROTEM, TEG and Sonoclot systems). Published: 20 August 2014. nice.org.uk/guidance/dg13.
Peng HT, Nascimento B, Beckett A. Thromboelastography and Thromboelastometry in Assessment of Fibrinogen Deficiency and Prediction for Transfusion Requirement: A Descriptive Review. Biomed Res Int. 2018:7020539. Published 2018 Nov 25. doi:10.1155/2018/7020539
Rainer TH, Ho AM, Yeung JH, Cheung NK, Wong RS, Tang N et al. Early risk stratification of patients with major trauma requiring massive blood transfusion. Resuscitation. 2011;82:724–9.
Ratnoff OD, Menzie C. A new method for the determination of fibrinogen in small samples of plasma. Journal of Laboratory and Clinical Medicine. 1951;37:316–20.
Rizoli S, Min A, Sanchez AP, Shek P, Grodecki R, Veigas P et al. In trauma, conventional ROTEM and TEG results are not interchangeable but are similar in clinical applicability. Military Medicine. 2016;181:117–26.
ROTEM, 2019. Results Interpretation. 2019 TEM international GmBH. Available at https://www.rotem.de/en/methodology/result-interpretation-rotem-delta-und-sigma/ (accessed May 2019).
Roullet S, Pillot J, Freyburger G. Rotation thromboelastometry detects thrombocytopenia and hypofibrinogenaemia during orthotopic liver transplantation. Br J Anaesth. 2010;104:422–487.
Roullet S, Freyburger G, Cruc M, Quinart A, Stecken L, Audy M. Management of bleeding and transfusion during liver transplantation before and after the introduction of a rotational thromboelastometry-based algorithm. Liver Transpl. 2015;21:169–79.
Schlimp CJ, Khadem A, Klotz A, Solomon C, Hochleitner G, Ponschab M et al. Rapid measurement of fibrinogen concentration in whole blood using a steel ball coagulometer. J Trauma Acute Care Surg. 2015;78:830–6.
Schöchl H, Nienaber U, Maegele M, Hochleitner G, Primavesi F, Steitz B et al. Transfusion in trauma: thromboelastometry-guided coagulation factor concentrate-based therapy versus standard fresh frozen plasma-based therapy. Crit Care. 2011;15:R83.
Seo H, Choi JH, Moon YJ, Jeong SM. FIBTEM of Thromboelastometry does not Accurately Represent Fibrinogen Concentration in Patients with Severe Hypofibrinogenemia During Liver Transplantation. Ann Transplant. 2015;20:342–50.
Sobas F, Hanss M, Ffrench P, Trzeciak MC, Dechavanne M, Négrier C. Human plasma fibrinogen measurement derived from activated partial thromboplastin time clot formation. Blood Coagul Fibrinolysis. 2002;13:61–8.
Solomon C, Cadamuro J, Ziegler B, Schöchl H, Varvenne M, Sørensen B et al. Comparison of fibrinogen measurement methods with fibrin clot elasticity assessed by thromboelastometry, before and after administration of fibrinogen concentrate in cardiac surgery patients. Transfusion. 2011;51:1695–706.
Solomon C, Collis RE, Collins PW. Haemostatic monitoring during postpartum haemorrhage and implications for management. Br J Anaesth. 2012;109:851–63.
Solomon C, Asmis LM, Spahn DR. Is viscoelastic coagulation monitoring with ROTEM or TEG validated? Scand J Clin Lab Invest. 2016;76:503–7.
Song JG, Jeong SM, Jun IG, Lee HM, Hwang GS. Five-minute parameter of thromboelastometry is sufficient to detect thrombocytopenia and hypofibrinogenaemia in patients undergoing liver transplantation. Br J Anaesth. 2014;112:290–7.
Spahn DR, Bouillon B, Cerny V, Coats TJ, Duranteau J, Fernandez-Mondejar E et al. Management of bleeding and coagulopathy following major trauma: an updated European guideline. Crit Care. 2013;17:R76.
Spahn DR. TEG®- or ROTEM®-based individualized goal-directed coagulation algorithms: don’t wait – act now! Crit Care. 2014;18:637.
Spahn DR, Bouillon B, Cerny V, Duranteau J, Filipescu D, Hunt BJ et al. The European guideline on management of major bleeding and coagulopathy following trauma: fifth edition. Crit Care. 2019;23:98.
Tirotta CF, Lagueruela RG, Madril D, Salyakina D, Wang W, Taylor T et al. Correlation Between ROTEM FIBTEM Maximum Clot Firmness and Fibrinogen Levels in Pediatric Cardiac Surgery Patients. Clin Appl Thromb Hemost. 2019;25:1-5. https://doi.org/10.1177/1076029618816382
Undas A. How to Assess Fibrinogen Levels and Fibrin Clot Properties in Clinical Practice? Semin Thromb Hemost. 2016;42:381–88.
van Rheenen-Flach LE, Zweegman S, Boersma F, Lenglet JE, Twisk JW, Bolte AC. A prospective longitudinal study on rotation thromboelastometry in women with uncomplicated pregnancies and postpartum. Aust N Z J Obstet Gynaecol. 2013;53:32–36.
Walden K, Jeppsson A, Nasic S, Backlund E, Karlsson M. Low Preoperative Fibrinogen Plasma Concentration Is Associated With Excessive Bleeding After Cardiac Operations. Ann Thorac Surg. 2014;97:1199–206.
Walsh M, Thomas SG, Howard JC, Evans E, Guyer K, Medvecz A et al. Blood component therapy in trauma guided with the utilization of the perfusionist and thromboelastography. J Extra Corpor Technol. 2011;43:162–7.
Weber CF, Görlinger K, Meininger D, Herrmann E, Bingold T, Moritz A et al. Point-of-care testing: a prospective, randomized clinical trial of efficacy in coagulopathic cardiac surgery patients. Anesthesiology. 2012;117:531–47.
Whiting P, Al M, Westwood M, Ramos IC, Ryder S, Armstrong N et al. Viscoelastic point-of-care testing to assist with the diagnosis, management and monitoring of haemostasis: a systematic review and cost-effectiveness analysis. Health Technol Assess. 2015;19:1–228.
Winearls J, Reade M, Miles H, Bulmer A, Campbell D, Görlinger K et al. Targeted coagulation management in severe trauma: The controversies and the evidence. Anesth Analg. 2016;123:910–24.
Yang LS, Tanaka KA, Abuelkasem E, Planinsic RM, Sakai T. Clinical applicability of rapid thrombelastography and functional fibrinogen thrombelastography to adult liver transplantation. Liver Transpl. 2014;20:1097–105.
Zostautiene I, Zvinienė K, Trepenaitis D, Gerbutavičius R, Mickevičius A, Gerbutavičienė R et al. Thromboelastographic changes during laparoscopic fundoplication. Wideochir Inne Tech Maloinwazyjne. 2017;12:19–27.
of interest
are looking at
saved
next event
Developed by EPG Health for Medthority in collaboration with CSL Behring, with content provided by CSL Behring.
Not intended for Healthcare Professionals outside Europe.